

National Multidimensional Poverty Index (MPI)
The National Multidimensional Poverty Index (MPI) measures poverty in India by assessing multiple deprivations experienced by households in health, education and standard of living, rather than relying solely on income or consumption expenditure.
Key Features
- Developed By: NITI Aayog in collaboration with United Nations Development Programme (UNDP), and Oxford Poverty and Human Development Initiative (OPHI) developed the National Multidimensional Poverty Index (MPI) that offers a multi-dimensional perspective on poverty.
- Methodology: Both the Global MPI and India’s National MPI use the Alkire–Foster (AF) methodology to identify and measure multidimensional poverty.
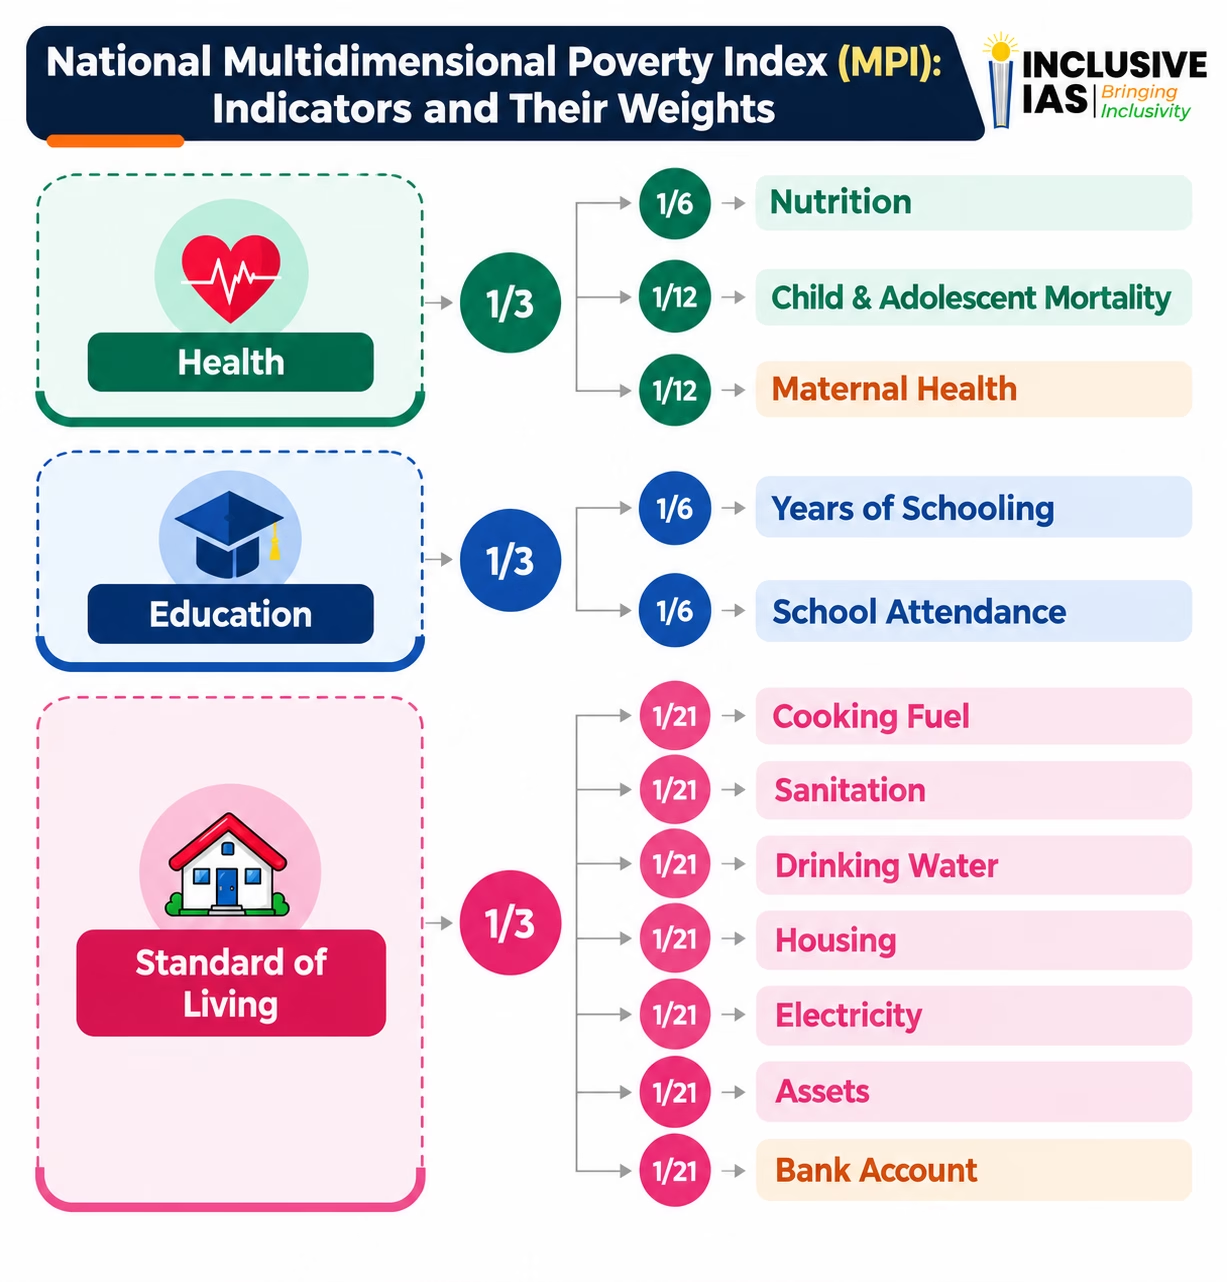
- Dimensions: Like the Global Multidimensional Poverty Index (MPI), India’s national MPI has three equally weighted dimensions – Health, Education, and Standard of living – which are represented by 12 indicators.
- Indicators: Uses 12 indicators, retaining all 10 indicators of the Global MPI and adding two additional indicators—Maternal Health under Health and Bank Account under Standard of Living.
- The 12 indicators are Nutrition, Child and Adolescent Mortality, Maternal Health, Years of Schooling, School Attendance, Cooking Fuel, Sanitation, Drinking Water, Electricity, Housing, Assets and Bank Account.
- Editions: Two editions of the National Multidimensional Poverty Index (MPI) have been published—the first in 2021 and the second in 2023.
- First Edition (Baseline Report): National Multidimensional Poverty Index: Baseline Report (published in November 2021, based on NFHS-4 data from 2015–16).
- Second Edition: National Multidimensional Poverty Index: A Progress Review 2023 (published in August 2023, based on NFHS-5 data from 2019–21).
Sub-indices of the National MPI
The National Multidimensional Poverty Index (MPI) for India uses two primary sub-indices to calculate the overall MPI value.
- Headcount ratio (H): How many are poor? Proportion of multidimensionally poor in the population, which is arrived at by dividing the number of multidimensionally poor persons by total population.
- Intensity of poverty (A): How poor are the poor? Average proportion of deprivations which is experienced by multidimensionally poor individuals. To compute intensity, the weighted deprivation scores of all poor people are summed and then divided by the total number of poor people.
MPI value is arrived at by multiplying the headcount ratio (H) and the intensity of poverty (A), reflecting both the share of people in poverty and the degree to which they are deprived
According to the AF methodology, an individual is considered MPI poor if their deprivation score equals or exceeds the poverty cutoff of 33.33%.
Global Multidimensional Poverty Index (MPI)
- Historically, poverty estimation has predominantly relied on income as the sole indicator.
- However, the Global Multidimensional Poverty Index (MPI), based on the Alkire-Foster (AF) methodology, captures overlapping deprivations in health, education, and living standards. It complements income poverty measurements because it measures and compares deprivations directly.
- The global MPI Report is jointly published by the Oxford Poverty and Human Development Initiative (OPHI) and the United Nations Development Programme (UNDP)
National Multidimensional Poverty Index: A Progress Review (2023)
The National Multidimensional Poverty Index (MPI): A Progress Review 2023, published by NITI Aayog, is the second edition of India’s national MPI. Based on data from the 5th round of the National Family Health Survey (NFHS-5 conducted in 2019-21), the report tracks India's progress in reducing multidimensional poverty against the baseline report (NFHS-4 conducted in 2015-16).
Key Features
- Coverage: Provides multidimensional poverty estimates for all 36 States and Union Territories and 707 administrative districts across 12 indicators.
- Data Source: Based on the National Family Health Survey (NFHS-5), conducted during 2019–21.
- Comparison: This edition presents the changes in multidimensional poverty between the survey periods of NFHS-4 (2015-16) and NFHS-5 (2019-21).
Key Findings
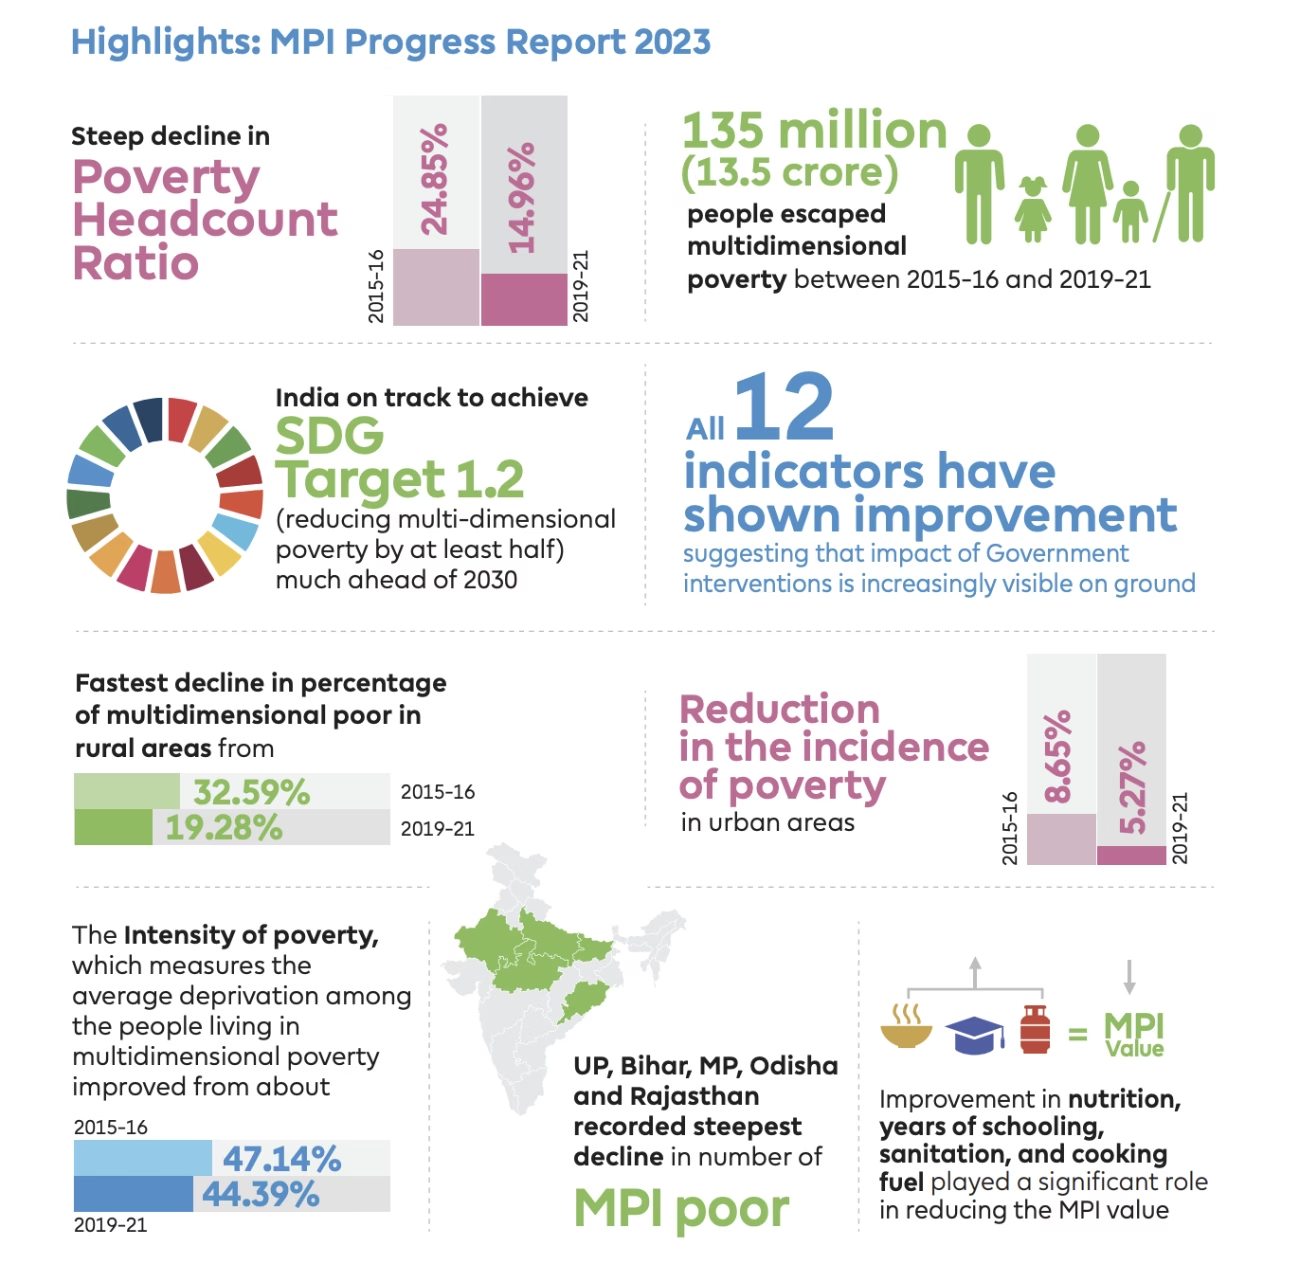
- MPI Value: India’s National MPI value declined by nearly half between 2015–16 and 2019–21.
- Reduction in Poverty: The proportion of India’s population living in multidimensional poverty declined by 9.89 percentage points, from 24.85% in 2015–16 to 14.96% in 2019–21.
- People Escaping Poverty: This reduction of 9.89 percentage points in multidimensional poverty indicates that, at the level of projected population in 2021, about 135.5 million persons have escaped poverty between 2015-16 and 2019-21.
- Rural–Urban Disparities: In 2019–21, the proportion of multidimensionally poor people was higher in rural areas (19.28%) than in urban areas (5.27%).
- Rural–Urban Poverty: Multidimensional poverty declined in both rural and urban areas, with rural areas recording a larger absolute reduction in the MPI value.
- Rural Poverty: The proportion of multidimensionally poor people in rural areas declined from 32.59% to 19.28%.
- Urban Poverty: The proportion of multidimensionally poor people in urban areas declined from 8.65% to 5.27%.
- SDG Target 1.2: The findings indicated progress towards achieving SDG Target 1.2 that aims to reduce “at least by half the proportion of men, women and children of all ages living in poverty in all its dimensions according to national definitions”.
- Intensity of Poverty: The average weighted deprivation experienced by multidimensionally poor people declined from 47.14% to 44.39%.
- State-Wise Findings
- Bihar, the state with the highest MPI value in NFHS-4 (2015-16), saw the fastest reduction in MPI value in absolute terms with the proportion of multidimensional poor reducing from 51.89% to 33.76% in 2019-21. The next fastest reduction in the MPI value was seen in Madhya Pradesh and Uttar Pradesh.
- Largest Number of People Escaping Poverty: Uttar Pradesh recorded the highest number of people escaping multidimensional poverty (3.43 crore), followed by Bihar (2.25 crore) and Madhya Pradesh (1.36 crore).