


Poverty Estimation in India: Poverty Line & Committees
Poverty estimation is the process of measuring the extent of poverty in a population by identifying people living below a defined poverty line and calculating their proportion or number in the total population.
The poverty line is the minimum level of income or consumption expenditure required to meet basic needs, such as food, clothing, shelter, healthcare and education. People falling below this threshold are considered poor.
In India different expert committees have recommended methodologies for determining the poverty line.
History of Poverty Estimation in India
I. Pre-Independence Poverty Estimates
1. Dadabhai Naoroji (1867–68)
- First Poverty Estimate: One of the earliest estimations of poverty was done by Dadabhai Naoroji in his book, ‘Poverty and the Un-British Rule in India’.
- Poverty Line: Estimated a poverty line ranging from ₹16 to ₹35 per capita per year, based on 1867–68 prices.
- Methodology: The poverty line proposed by him was based on the cost of a subsistence diet consisting of ‘rice or flour, dhal, mutton, vegetables, ghee, vegetable oil and salt’.
2. National Planning Committee (1938)
- Poverty Line: Estimated a poverty line of ₹15–₹20 per capita per month.
- Methodology: It formulated its poverty line based on ‘a minimum standard of living perspective in which nutritional requirements are implicit’.
3. Bombay Plan (1944)
- Poverty Line: Authors of the Bombay Plan suggested a poverty line of Rs 75 per capita per year.
II. Post-Independence Poverty Estimates
4. Planning Commission Working Group (1962)
- Constitution: The Planning Commission constituted a Working Group in 1962 to estimate poverty in India. It formulated separate poverty lines for rural and urban areas.
- Rural Poverty Line: Recommended ₹20 per capita per month.
- Urban Poverty Line: Recommended ₹25 per capita per month.
- Price Base: The poverty lines were expressed at 1960–61 prices.
5. V. M. Dandekar and N. Rath (1971)
- First Systematic Assessment: Conducted the first systematic assessment of poverty in India using National Sample Survey (NSS) data from 1960–61.
- Calorie-Based Approach: They argued that the poverty line must be derived from the expenditure that was adequate to provide 2250 calories per day in both rural and urban areas.
6. Y. K. Alagh Committee (1979)
- Constitution: The Planning Commission constituted a Task Force on Projections of Minimum Needs and Effective Consumption Demand in 1977 under the chairmanship of Y. K. Alagh. The Task Force submitted its report in 1979.
- Methodology: Constructed a poverty line for rural and urban areas on the basis of nutritional requirements.
- The Alagh Committee fixed the poverty line at ₹49.09 per person per month in rural areas and ₹56.64 in urban areas, based on 1973–74 prices. These amounts corresponded to a basket of goods and services based on a minimum daily calorie requirement of 2,400 calories in rural areas and 2,100 calories in urban areas.
- Inflation Adjustment: Poverty lines for subsequent years were to be updated to account for changes in prices.
| Area | Calories | Minimum consumption expenditure (Rs per capita per month) |
|---|---|---|
| Rural | 2400 | 49.1 |
| Urban | 2100 | 56.7 |
7. D. T. Lakdawala Committee (1993)
- Constitution: In 1993, an expert group chaired by DT Lakdawala was constituted to review methodology for poverty estimation,
- Recommendations: It made the following suggestions:
- Consumption expenditure should be calculated based on calorie consumption as earlier;
- State-Specific Poverty Lines: State specific poverty lines should be constructed and these should be updated using the Consumer Price Index of Industrial Workers (CPI-IW) in urban areas and Consumer Price Index of Agricultural Labour (CPI-AL) in rural areas
- Discontinuation of scaling of poverty estimates based on National Accounts Statistics. This assumes that the basket of goods and services used to calculate CPI-IW and CPI-AL reflect the consumption patterns of the poor.
8. Suresh Tendulkar Committee (2009)
- Constitution: The Planning Commission constituted an Expert Group under Suresh Tendulkar in 2005 to review the methodology for poverty estimation. The Committee submitted its report in 2009.
- Major Recommendations:
- A shift away from calorie consumption based poverty estimation
- A uniform poverty line basket across rural and urban India;
- A change in the price adjustment procedure to correct spatial and temporal issues with price adjustment;
- Incorporation of private expenditure on health and education while estimating poverty.
- The Committee recommended using Mixed Reference Period (MRP) based estimates, as opposed to Uniform Reference Period (URP) based estimates that were used in earlier methods for estimating poverty.
- Consumption Basket: It based its calculations on the consumption of the following items: cereal, pulses, milk, edible oil, non-vegetarian items, vegetables, fresh fruits, dry fruits, sugar, salt & spices, other food, intoxicants, fuel, clothing, footwear, education, medical (non-institutional and institutional), entertainment, personal & toilet goods, other goods, other services and durables.
- State-Specific Poverty Lines: The Committee computed new poverty lines for rural and urban areas of each state. To do this, it used data on value and quantity consumed of the items mentioned above by the population that was classified as poor by the previous urban poverty line.
- Tendulkar Committee – Poverty Estimates (2004–05)
- Poverty Line: The Tendulkar Committee recommended a monthly per capita consumption expenditure of ₹446.68 in rural areas and ₹578.80 in urban areas as the poverty line for 2004–05.
- Poverty Ratio: Estimated that 41.8% of the rural population, 25.7% of the urban population and 37.2% of India’s total population lived below the poverty line in 2004–05.
- Population Below Poverty Line: Approximately 40.76 crore (407.6 million) people lived below the poverty line in 2004–05.
- Tendulkar Committee – Poverty Estimates (2011–12)
- Poverty Line (2011–12): It estimated the 2011–12 poverty line at Rs 816 (rural) and Rs 1,000 (urban) per capita per month.
- Poverty Ratio: Estimated that 25.7% of the rural population, 13.7% of the urban population and 21.9% of India’s total population lived below the poverty line in 2011–12.
- Population Below Poverty Line: Approximately 26.93 crore (269.3 million) people lived below the poverty line in 2011–12.
| Period / Year | Rural Poverty Line | Urban Poverty Line | All-India Headcount Ratio (Poverty Rate) |
|---|---|---|---|
| 2004–05 | ₹446.68 (~₹15/day) | ₹578.80 (~₹19/day) | 37.2% |
| 2011–12 | ₹816 (~₹27.2/day) | ₹1,000 (~₹33.3/day) | 21.9% |
9. Rangrajan Committee (2014)
- The Planning Commission constituted an Expert Group under the chairmanship of Dr. C. Rangarajan in June 2012 to review the methodology for poverty estimation in India. The Committee submitted its report on 30 June 2014. The panel was formed as a response to widespread public outrage and criticism that the previous Tendulkar Committee poverty line was unrealistically low.
- Major Highlights
- Recommended separate consumption baskets for rural and urban areas, unlike the Tendulkar Committee, which used a common reference poverty line basket.
- The poverty line should be based on certain normative levels of adequate nourishment, clothing, house rent, conveyance and education, and a behaviorally determined level of other non-food expenses.
- The Expert Group (Rangarajan) computed the average requirements of calories, proteins and fats based on ICMR norms differentiated by age, gender and activity for all-India rural and urban regions to derive the normative levels of nourishment. Accordingly, the energy requirement works out to 2,155 kcal per person per day in rural areas and 2,090 kcal per person per day in urban areas.
- The Expert Group (Rangarajan) used the Modified Mixed Recall Period consumption expenditure data of the NSSO as these are considered to be more precise compared to the MRP, which was used by the Expert Group (Tendulkar) and the URP, which was used by earlier estimations.
- Poverty Estimates:
- Rural Poverty Line: ₹972 per person per month, equivalent to approximately ₹32 per day.
- Urban Poverty Line: ₹1,407 per person per month, equivalent to approximately ₹47 per day.
- Poverty Ratio: Estimated that 30.9% of the rural population, 26.4% of the urban population and 29.5% of India’s total population lived below the poverty line in 2011–12.
- Population Below Poverty Line: Approximately 36.3 crore (363 million) people lived below the poverty line in 2011–12, comprising 26.05 crore in rural areas and 10.25 crore in urban areas.
Identification of Poor for Government Schemes
- In India, State Governments identify poor households for various welfare schemes using data from Below Poverty Line (BPL) surveys of which the latest is the Socio-Economic Caste Census 2011 (SECC 2011).
World Bank’s International Poverty Line
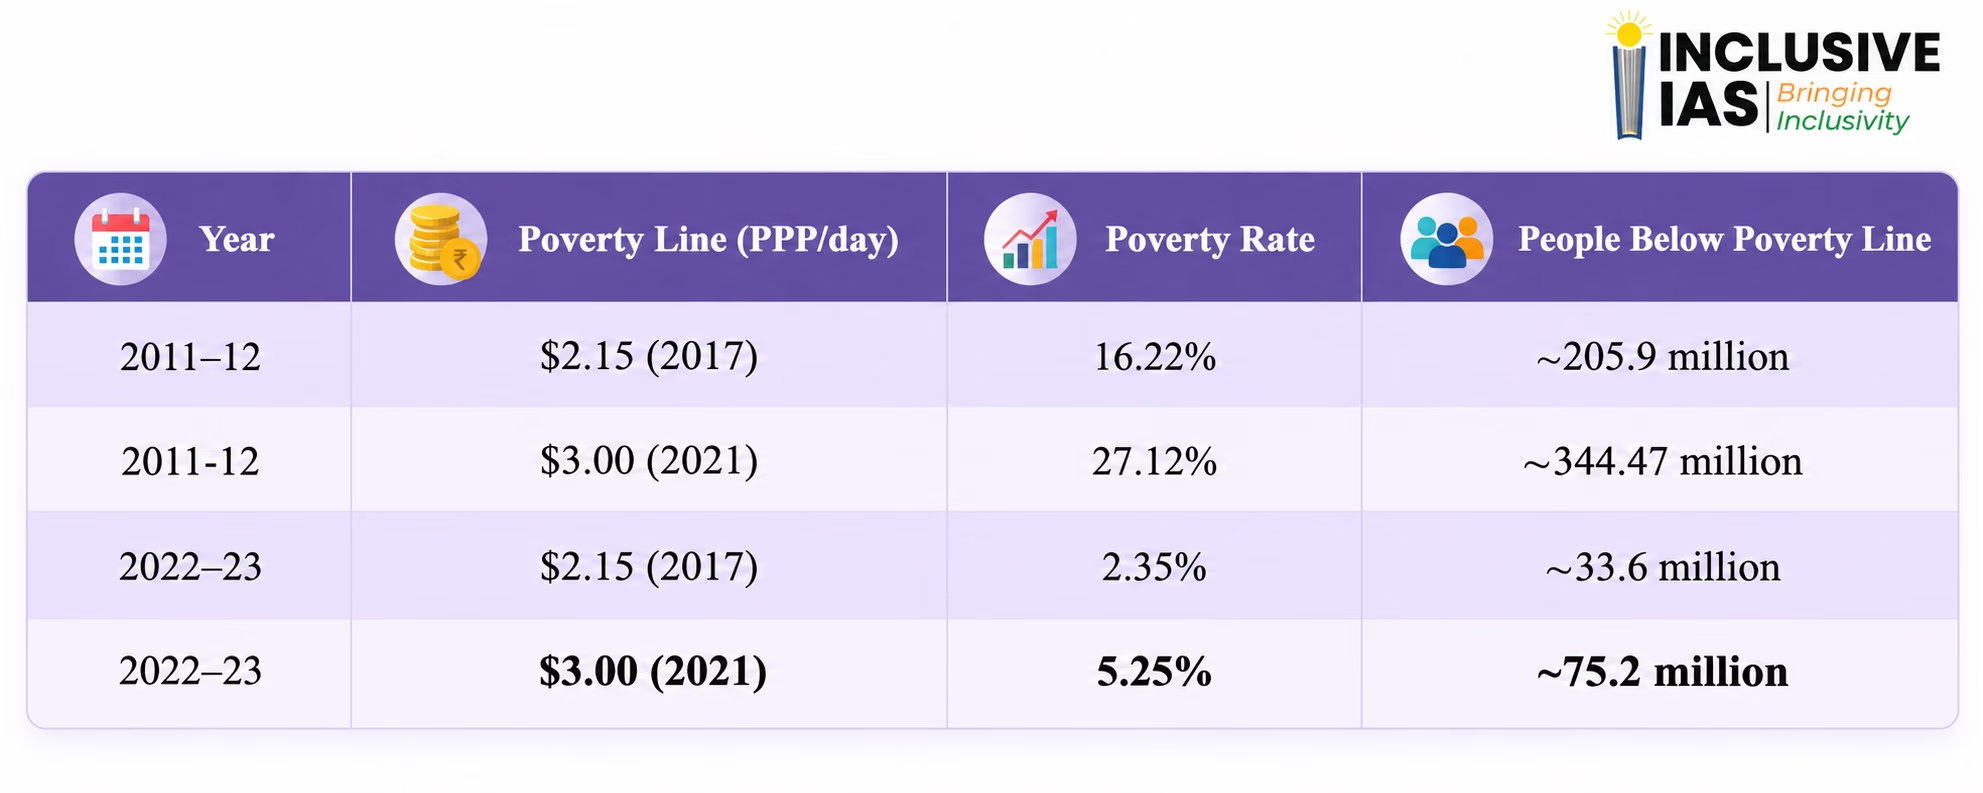
In June 2025, the World Bank revised the International Poverty Line (IPL) from $2.15 per person per day at 2017 Purchasing Power Parity (PPP) to $3.00 per person per day at 2021 PPP.
1. Global Poverty Estimates
- Increase in Extreme Poverty: The revised methodology increased the estimated number of people living in extreme poverty worldwide in 2022 from 713 million to 838 million, an upward revision of approximately 125 million people.
- While the change led to a global increase in the count of extreme poverty by 125 million, India emerged as a statistical outlier in a positive direction. Using more refined data and updated survey methods, India not only withstood the raised threshold but also demonstrated a massive reduction in poverty. The new poverty line would have increased the count of global extreme poverty by 226 million people. But thanks to India’s data revision, the net global increase was only 125 million — as India’s revised data reduced the count by 125 million on its own.
2. India’s Revised Poverty Estimates
- At $3/day level, the share of India’s population living in extreme poverty is estimated to be 5.3%, a steep fall from 27.1% in 2011-12.
- At the $2.15/day line (previous international standard based on 2017 PPP), India’s extreme poverty rate stood at 2.3% in 2022, compared to 16.2% in 2011-12.
National Multidimensional Poverty Index (MPI)
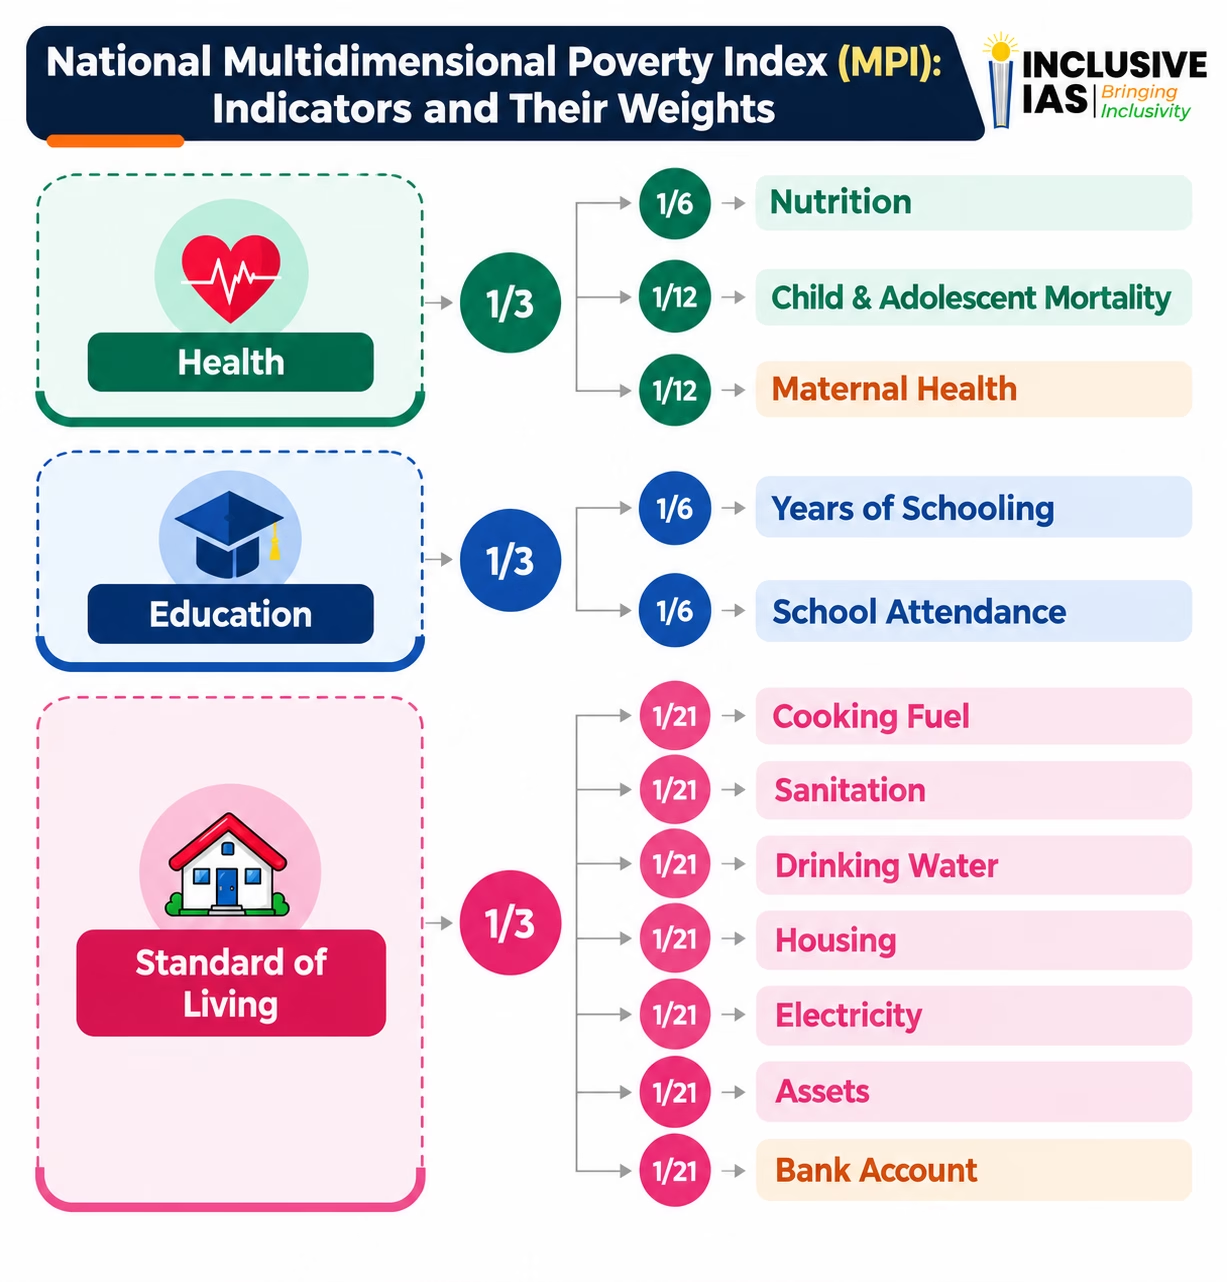
The National Multidimensional Poverty Index (MPI) measures poverty in India by assessing multiple deprivations experienced by households in health, education and standard of living, rather than relying solely on income or consumption expenditure.
Key Features
- Developed By: NITI Aayog in collaboration with United Nations Development Programme (UNDP), and Oxford Poverty and Human Development Initiative (OPHI) developed the National Multidimensional Poverty Index (MPI) that offers a multi-dimensional perspective on poverty.
- Methodology: Both the Global MPI and India’s National MPI use the Alkire–Foster (AF) methodology to identify and measure multidimensional poverty.
- Dimensions: Like the global MPI, It also consists of three equally weighted dimensions—Health, Education and Standard of Living.
- Indicators: Uses 12 indicators, retaining all 10 indicators of the Global MPI and adding two additional indicators—Maternal Health under Health and Bank Account under Standard of Living.
- The 12 indicators are Nutrition, Child and Adolescent Mortality, Maternal Health, Years of Schooling, School Attendance, Cooking Fuel, Sanitation, Drinking Water, Electricity, Housing, Assets and Bank Account.
- Editions: Two editions of the National Multidimensional Poverty Index (MPI) have been published—the first in 2021 and the second in 2023.
National Multidimensional Poverty Index: A Progress Review (2023)
The National Multidimensional Poverty Index (MPI): A Progress Review 2023, published by NITI Aayog, is the second edition of India’s national MPI. Based on data from the 5th round of the National Family Health Survey (NFHS-5 conducted in 2019-21), the report tracks India's progress in reducing multidimensional poverty against the baseline report (NFHS-4 conducted in 2015-16).
Key Features
- Coverage: Provides multidimensional poverty estimates for all 36 States and Union Territories and 707 administrative districts across 12 indicators.
- Data Source: Based on the National Family Health Survey (NFHS-5), conducted during 2019–21.
- Comparison: This edition presents the changes in multidimensional poverty between the survey periods of NFHS-4 (2015-16) and NFHS-5 (2019-21).
Key Findings
- MPI Value: India’s National MPI value declined by nearly half between 2015–16 and 2019–21.
- Reduction in Poverty: The proportion of India’s population living in multidimensional poverty declined by 9.89 percentage points, from 24.85% in 2015–16 to 14.96% in 2019–21.
- People Escaping Poverty: This reduction of 9.89 percentage points in multidimensional poverty indicates that, at the level of projected population in 2021, about 135.5 million persons have escaped poverty between 2015-16 and 2019-21.
- SDG Target 1.2: The findings indicated progress towards achieving SDG Target 1.2 that aims to reduce “at least by half the proportion of men, women and children of all ages living in poverty in all its dimensions according to national definitions”.
- Intensity of Poverty: The average weighted deprivation experienced by multidimensionally poor people declined from 47.14% to 44.39%.