The Phillips Curve remains a valuable conceptual tool in economics, particularly for understanding short-term trade-offs between inflation and unemployment. However, its limitations—especially in the face of supply shocks and inflation expectations—have prompted economists to refine it with adaptive models. While it is no longer a one-size-fits-all framework, it continues to inform monetary policy in conjunction with other macroeconomic indicators.
FAQs
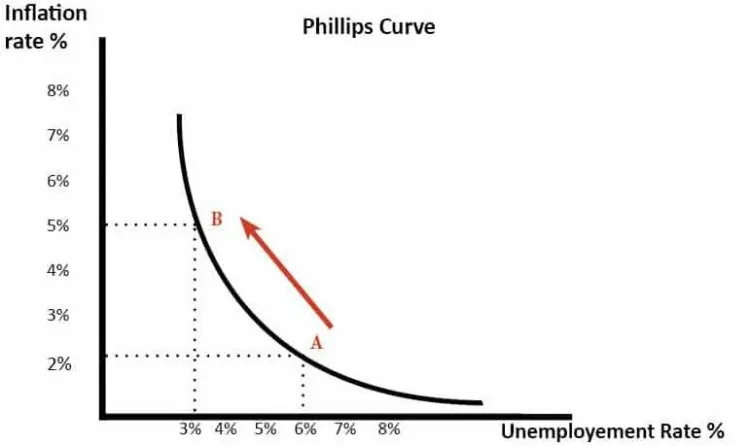
Q1. What does the Phillips Curve show?
It shows an inverse relationship between inflation and unemployment in the short run.
Q2. Is the Phillips Curve still valid today?
Partially. In the short run, it may apply, but in the long run, it breaks down due to inflation expectations.
Q3. What caused the breakdown of the Phillips Curve?
Stagflation in the 1970s – simultaneous rise in inflation and unemployment.
At InclusiveIAS, our editorial team is led by experts who have successfully cleared multiple stages of the UPSC Civil Services Examination, including Mains and Interview. With deep insights into the demands of the exam, we focus on crafting content that is accurate, exam-relevant, and easy to grasp.
Whether it’s Polity, Current Affairs, GS papers, or Optional subjects, our notes are designed to:
Break down complex topics into simple, structured points
Align strictly with the UPSC syllabus and PYQ trends
Save your time by offering crisp yet comprehensive coverage
Help you score more with smart presentation, keywords, and examples
🟢 Every article, note, and test is not just written—but carefully edited to ensure it helps you study faster, revise better, and write answers like a topper.